Read our market review and find out all about our theme of the week in MyStratWeekly and its podcast with our experts Axel Botte, Aline Goupil-Raguénès and Zouhoure Bousbih.
Listen to podcast (in French only)
(Listen to) Axel Botte’s and Zouhoure Bousbih’s podcast:
- Review of the week – Financial markets, US GDP and inflation;
- Theme – Beijing and US Debt: Another Step in De-dollarization.
Podcast slides (in French only)
Download the Podcast slides (in French only)Topic of the week: Beijing and US Debt: Another Step in De-dollarization
- The February 9th verbal directive—or "window guidance"—from Chinese regulators instructing financial institutions to curb their purchases of US Treasuries marks a strategic shift, rather than a sudden rupture.
- China’s official US Treasury holdings have declined from $1.3T (2013) to $683B (Nov 2025), pulling its share of foreign Treasuries down from 28.8% (2011) to 7.3%.
- Some holdings sit with European custodians (Belgium, Luxembourg) or Chinese banks, masking the full divestment scale.
- Simultaneously, China is speeding up gold accumulation and building storage/delivery infrastructure as a core part of de-dollarization.
- The divestment by Chinese commercial banks is being executed through flows rather than through large-scale sell-offs. This approach mitigates the risk of a disorderly shock to the US sovereign bond market and explains the market's limited and transitory reaction to the announcement.
- Nevertheless, beneath this apparent market calm, Beijing is accelerating its de-dollarization drive. This move is part of a long-term monetary transition, reminiscent of the currency competition between the British pound and the US dollar during the 20th century.
China and U.S. Debt: An Overview, with Blurred Margins
A steady erosion of Treasuries stocks
China accumulated U.S. Treasury securities by reinvesting the dollars from its massive exports. These Treasuries served as ultra-secure foreign exchange reserves, given the very low default risk of the U.S. government. China publishes the size of its foreign exchange reserves (about $3.4 trillion) but refuses to disclose the exact breakdown by currency and asset type. The composition of reserves is treated as a matter of national security.
Since its peak of $1.3 trillion in 2013, China’s holdings of U.S. Treasuries have steadily eroded, falling to $683 billion…
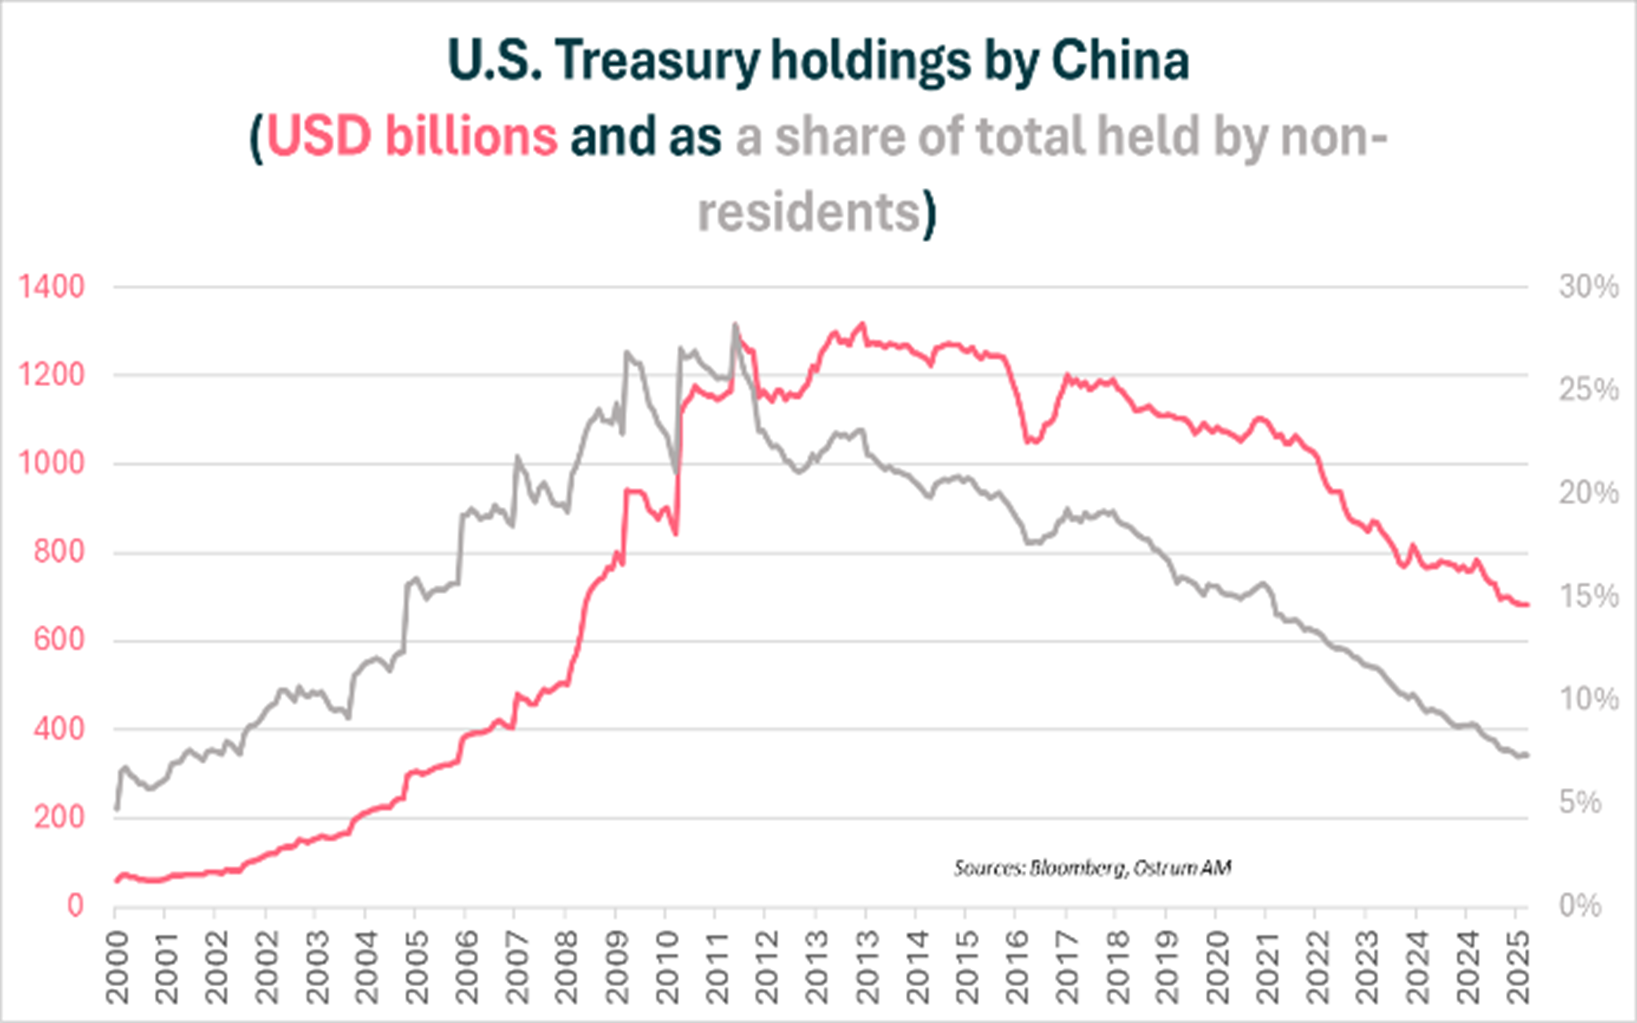
The available data come from the U.S. Treasury via the monthly TIC (Treasury International Capital) report, so the official source is paradoxically American. From a 2013 peak of $1.3 trillion, China’s stock of U.S. Treasuries has eroded gradually to $683 billion in November 2025, reducing its share of foreign-held Treasuries from 28.8% in 2011 to 7.3%, a low since 2008.
The “shadow” reserves : Belgium and Luxembourg
… However, this apparent decline partly masks a shift toward European intermediaries (Belgium, Luxembourg) …
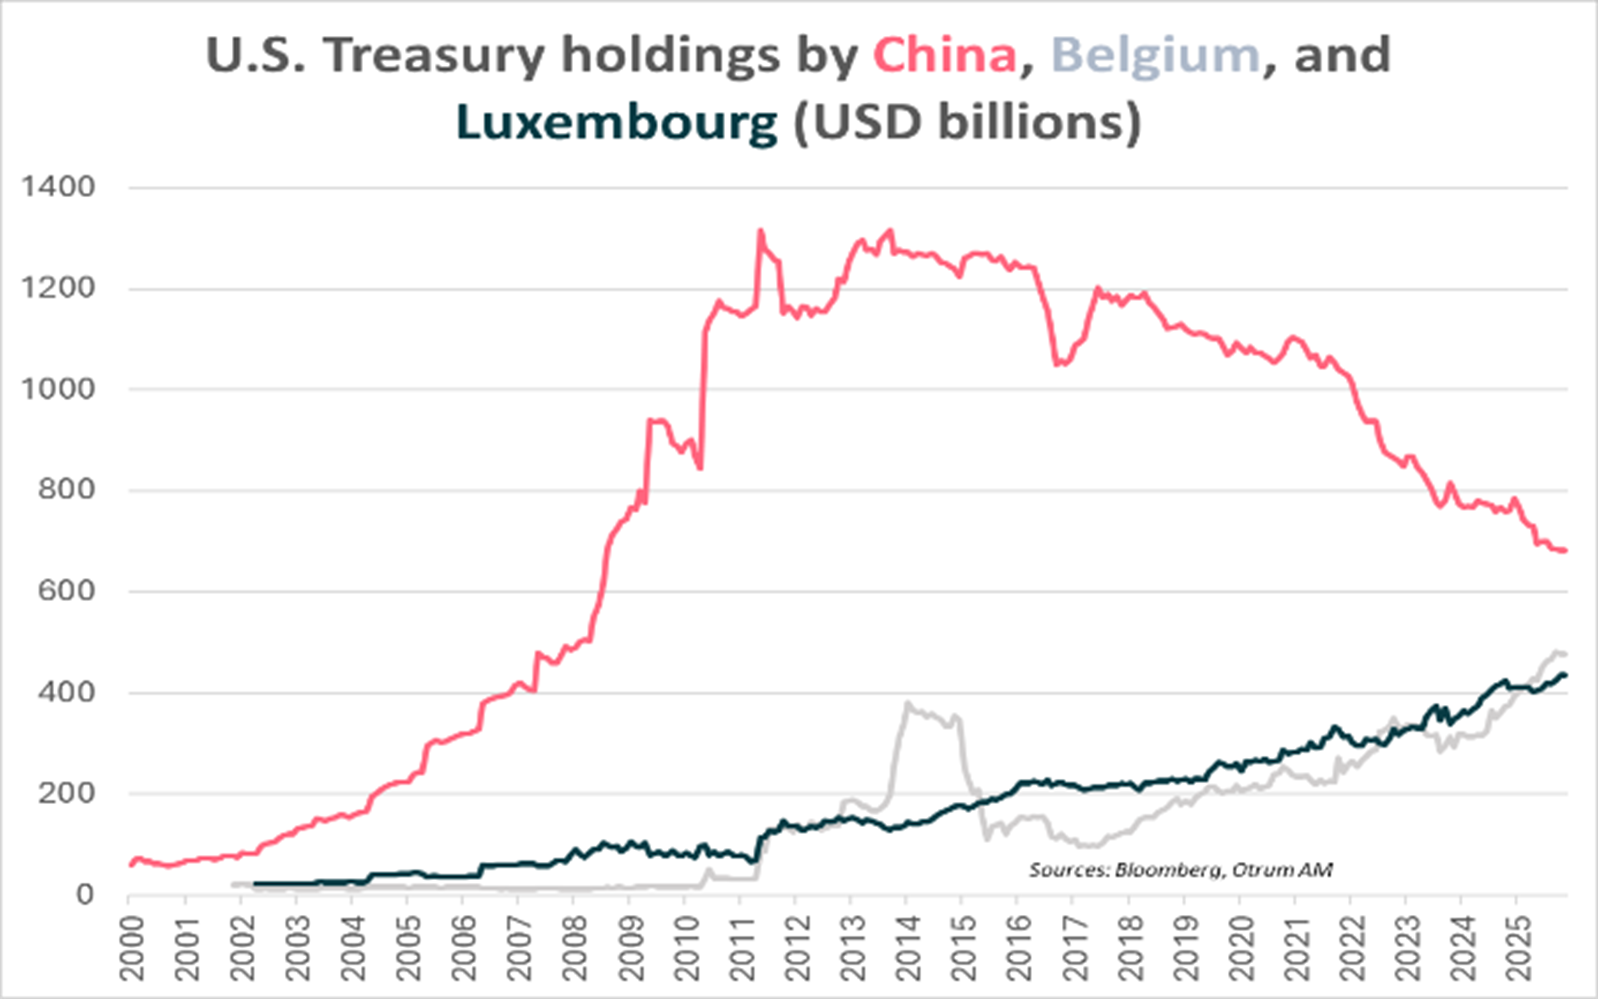
Many analysts, including Brad Setser of the Council on Foreign Relations, consider that official U.S. figures may understate the reality. Indeed, China sometimes uses state-owned commercial banks or intermediaries based in Belgium or Luxembourg to acquire U.S. securities. These intermediaries are not retail banks but “giant digital safes” for global financial assets: Euroclear (Brussels) and Clearstream (Luxembourg).
These transactions do not appear under the label “China” in official reports, allowing Beijing to mask the true scale of its moves in the U.S. debt market. Thus, China is not necessarily “liquidating” all of its U.S. debt, but moving a portion to European platforms.
Belgium also hosts the majority of frozen Russian assets, placing it in an extremely delicate diplomatic and financial position. Chinese authorities watch with acute vigilance, ready to withdraw their colossal dollar and euro holdings at any moment, potentially triggering a loss of global confidence in the euro and in Euroclear.
The Shift from Public to Private
… As well as toward private‑sector commercial banks.
For several years, a gradual shift has been evident: fewer U.S. Treasuries on the central bank's official balance sheet (PBOC), but more on the balance sheets of state-owned commercial banks.
According to SAFE (State Administration of Foreign Exchange), which manages and controls foreign exchange flows, banks held a total of $298 billion in U.S. Treasury securities as of end-September 2025. Breakdown by security type is not available. This public-to-private shift allows authorities to maintain rapid responsiveness without a sharp political signal and to move risk exposure.
The Great Move to Gold
A response to the risk of U.S. financial sanctions
Since the freezing of Russian assets, the PBOC has resumed its gold purchases on a near‑continuous basis, with an acceleration since November 2024.
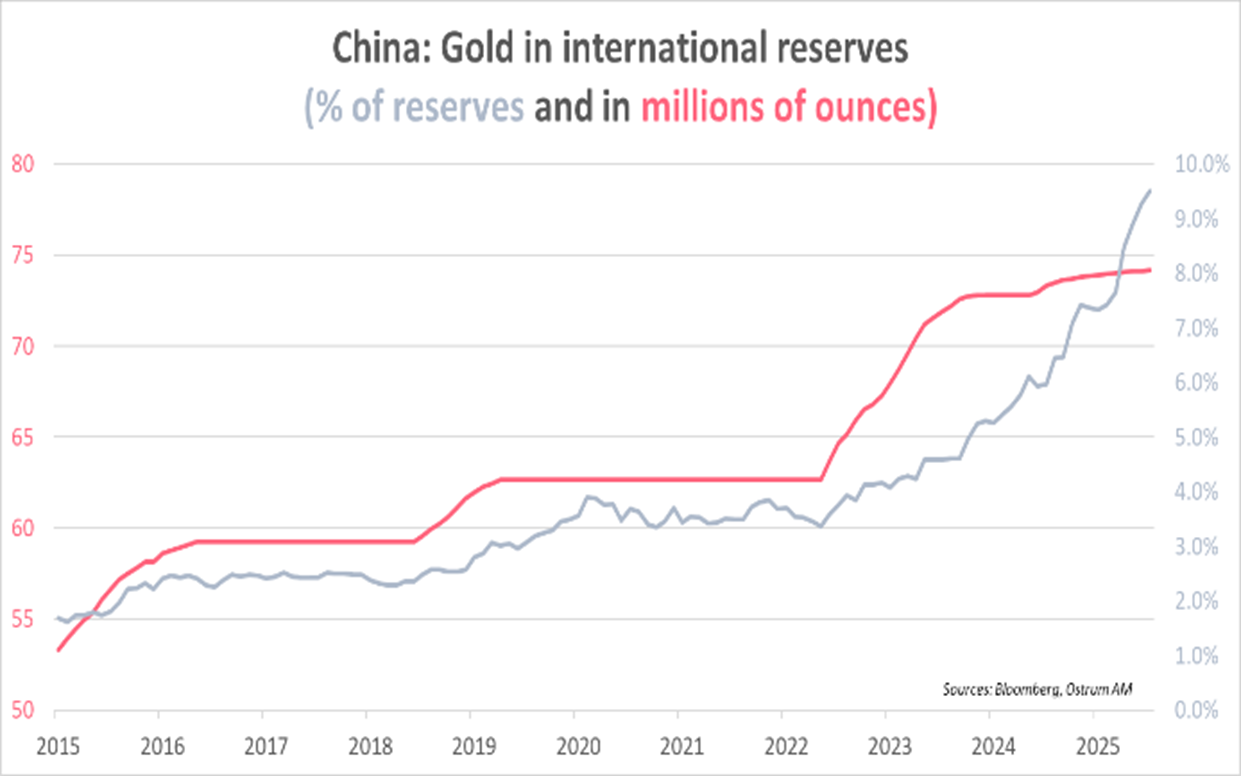
China’s accumulation of gold reserves is part of its de-dollarization strategy. Since the Russian asset freeze at the end of 2022, the PBOC has resumed gold purchases in a near-continuous fashion, accelerating since November 2024 and supporting higher gold prices. Gold reserves reached 74.19 million troy ounces in January 2026, about 2,308 tonnes, and close to 11% of the PBOC’s reserves, although this remains below the often-cited 15% threshold.
Gold as a Vehicle for Renminbi Internationalization
China is not only accumulating gold reserves but has built a global storage and delivery infrastructure for the precious metal. Created in 2022, the Shanghai Gold Exchange (SGE) is today the world’s largest physical gold market by volume with a delivery-forcing framework, in contrast to Western markets dominated by London (LBMA) and New York (Comex). The table below compares the characteristics of the three major global gold markets.
China has built a global infrastructure for the storage and delivery of precious metals, which plays a key role in the internationalization of the renminbi.
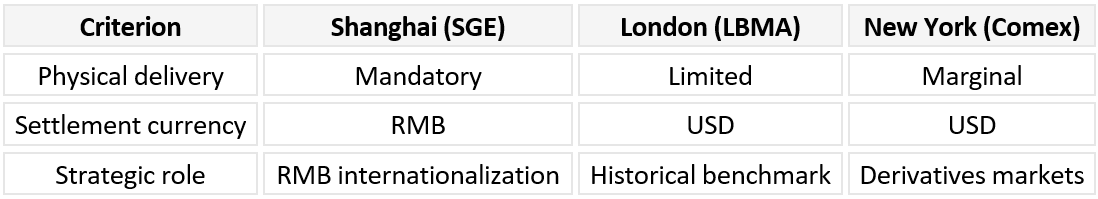
In 2014, China established the Shanghai Gold Exchange International (SGEI) located in a free-trade zone, allowing participation by foreign actors, with renminbi-denominated contracts but without relaxing capital controls. Thanks to its infrastructure, China is no longer a price-taker but a market-maker in gold, giving it a central role in its gradual renminbi internationalization strategy. The framework is based on trades and investments denominated in renminbi, with the option of indirect conversion into gold via the Shanghai Gold Exchange (SGE) without a full liberalization of the capital account (non-convertibility).
Historical Perspectives: From the British Pound to the U.S.
China appears to be embarking on a monetary transition comparable to that of the pound sterling and the U.S. dollar in the 20th century.
Dollar China’s appetite for precious metals goes beyond mere risk protection; it signals a shift in monetary power.
The dollar established itself as the world’s reserve currency, displacing the pound sterling—a process Barry Eichengreen describes as neither brutal nor instantaneous, yet one that took almost 40 years and relied on strategic gold accumulation. Before World War I, the United Kingdom was the global financial center, and British government debt was regarded as the safest asset in the world. The pound sterling was the world’s reserve currency.
The United States had accumulated a large amount of British sovereign debt, integrating into the prevailing financial system. Between 1914 and 1917, the United States became an industrial power and began reducing its positions in British debt due to concerns about financing the war (debt and gold outflows), converting these securities massively into gold and U.S. Treasuries. From 1919, the United States became the world’s creditor, and the dollar established itself as the new international benchmark. The depth of American financial markets and the relative political stability of the United States also gradually favored the dollar.
The pound sterling continued to play an international role into the 1940s, until Bretton Woods institutionalized the dollar’s dominance.
Consequences for Markets and Conclusion
The verbal directive of February 9th, urging Chinese banks to curb their purchases of U.S. debt marks a strategic shift, but not an immediate rupture.
No massive liquidation, no immediate shock.
As long as commercial banks continue to hold U.S. Treasuries, China remains integrated into the dollar system, and the risk of a disorderly shock in the U.S. sovereign bond market remains limited. Disengagement occurs through flows rather than stockpiles, favoring a gradual adjustment over a brutal liquidation. This strategy helps explain the market’s limited and transitional response to the announcement.
Nevertheless, behind this apparent calm, Beijing is accelerating the move toward de-dollarization as part of a long-term monetary transition that echoes the 20th-century currency competition between the pound sterling and the dollar. While that historical shift did not occur abruptly or instantaneously, the current transition could be more turbulent in a context of heightened hegemonic rivalry between the two powers.
Zouhoure Bousbih
Chart of the week
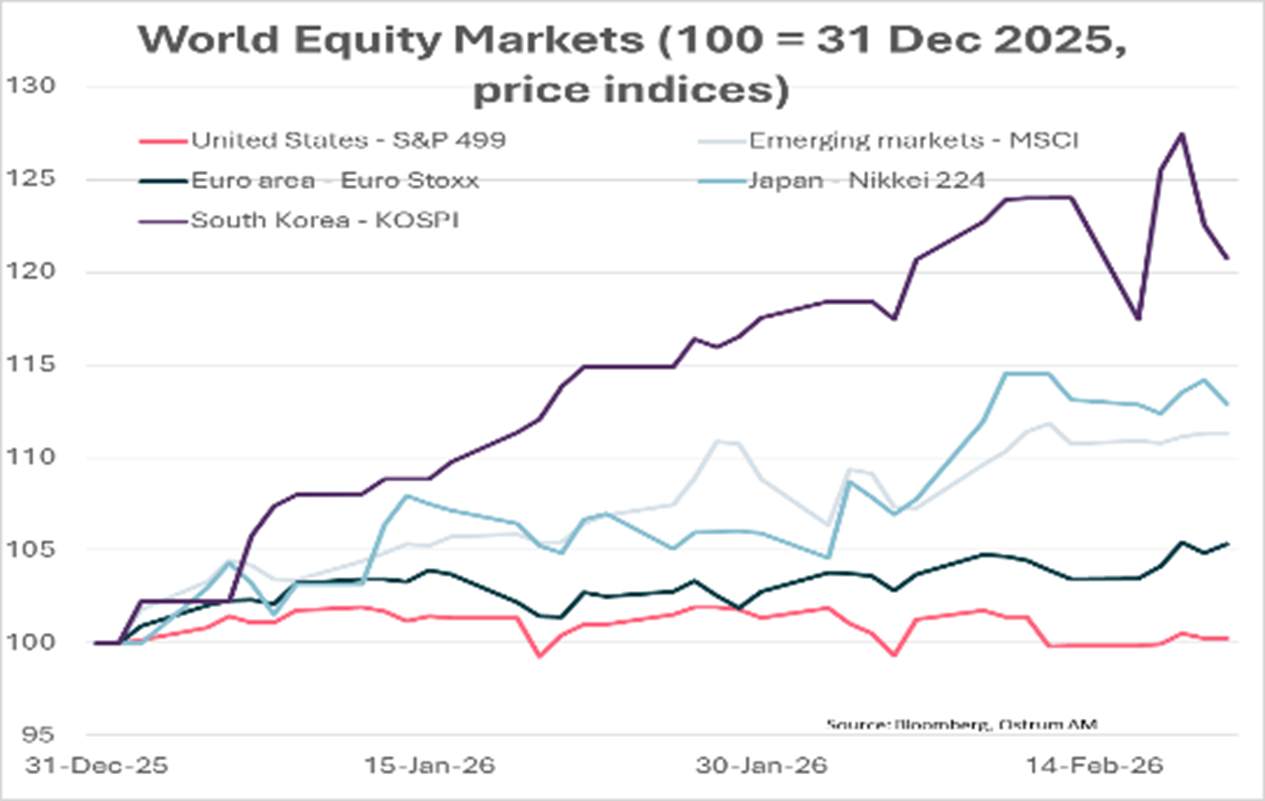
Performance gaps between stock indices have been very significant since the start of the year. Sectorial and geographic rotations are occurring rapidly. Markets fear the deleterious effects of AI diffusion and doubt the profitability of these substantial investment expenditures. This is prompting international investors to reduce their exposure to AI and to the dollar. Arbitrage from the United States to other cheaper markets with faster growth prospects is occurring in February. The Japanese and Korean markets (+20%) are also benefiting from the weakness of their currencies. Emerging markets (+11%) are also outperforming, with the added advantage of lower volatility. Finally, the economic upturn in the euro area is allowing markets to rise by 5%.
Figure of the week
600
$600 billion. That is the amount that the four largest American tech firms are investing in AI in 2026, double their 2025 total.
Market review:
- United States: GDP expands by 1.4 % in Q4 hit by shutdown.
- United States: Supreme Court strikes down Trump tariffs.
- Equities: U.S. markets down as Europe gains on recovery signals.
- Credit: Blue Owl closes private credit funds for retail accounts.
That 2007 feel
Growth is high yet imbalanced in the United States, liquidity strains among credit funds, and the capital creation and destruction tied to AI are fueling a sense of market fragility that prompts rapid portfolio rotations. Supreme Court strikes down Trump tariffs.
Markets appear adrift between the giant investment plans of hyperscalers that will weigh on both listed and unlisted credit markets, an imminent US intervention in Iran, and reallocations forced by redefining the dollar’s role. Oil trades above $70 a barrel. The yen weakens again after another disappointing Japanese inflation print. Long yields remain near their recent lows. Sovereign spreads or equities move without a clear trend, but the credit market looks a touch less supportive.
The US economy expanded at a 2.2% clip in 2025 versus 2.8% the prior year but is no longer creating jobs (just +15,000 per month on average). Productivity gains do not yet appear tied to AI diffusion, with few firms knowing how to monetize it at this stage. They mainly reflect spillovers from high spending growth in the tech sector, which absorbs substantial physical and financial resources at the expense of the rest of the economy, which is also facing tariff uncertainty. Growth slowed to 1.4% in the fourth quarter. The 43-day shutdown that paralyzed federal government services appears to have cost around one percentage point of GDP. Final sales to the private sector are up 2.4%. Productive investment in technology drives this, but the trade deficit has worsened again. Tariff policy has not allowed the external deficit to shrink over the past year. Household consumption slowed late in the year, and inflation remains elevated (3% on the core PCE deflator). The GDP deflator rose at an annualized pace of 3.6% in the final quarter. In the euro area, the German-led recovery is visible in February’s PMIs. Industrial orders surged late last year, and activity responds to fiscal stimulus. Negotiated wage growth ended on a positive note at 2.95% in Q4. This rebound arrives earlier than the ECB wage tracker had anticipated.
Western equity markets drift without a clear trend. AI poses an existential challenge for some sectors, if the price action is anything to judge. That disruption raises stock-level volatility, yet VIX and V2X hover around 20%, far from panic levels. The Nasdaq index falls 1% over the week. The dollar’s rebound and growth signals cushion European indices (+1.8%), helped by banks and cyclicals. Yet since the start of the results season, better-than-expected reports have not guaranteed a positive market reaction. That hints at fragility or heightened selectivity among investors. Private credit liquidity problems add another layer of anxiety. In rates land, the 10-year note yields about 4.07%, comfortably distant from the 4.20% threshold that marked its prior sideways drift. The plunge in the Japanese 30-year yield, from 3.86% to 3.31% in a month, has steepened curve flattening across major markets. Australia’s curve flattening is reinforced by unemployment data that validates the anticipated tightening stance. Sovereign and credit spreads remain resilient, even as primary-market activity weighs.
Axel Botte
Main market indicators